With ForNAV 7.0, you can create a custom Excel report, which has several benefits.
You can:
- Create the report without writing AL code – it only requires knowledge about the Business Central data model.
- Easily add data from related tables.
- Create a separate Excel worksheet per data item, which is better suited for Excel than the flat dataset created in standard Business Central.
- Use translated captions for columns and worksheet names, instead of the standard Al-column names in Business Central.
- Drill-back into the Business Central client using hyperlinks.
To create an Excel report in the ForNAV Designer:
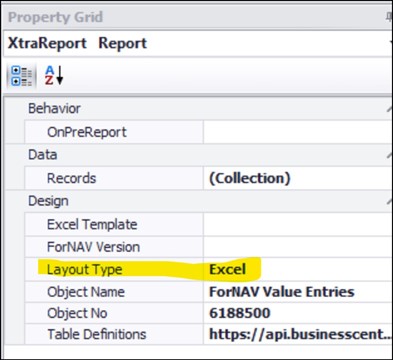
1) Set the Layout Type field to Excel.
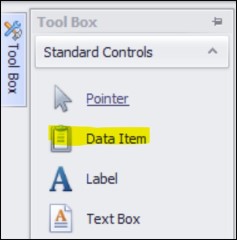
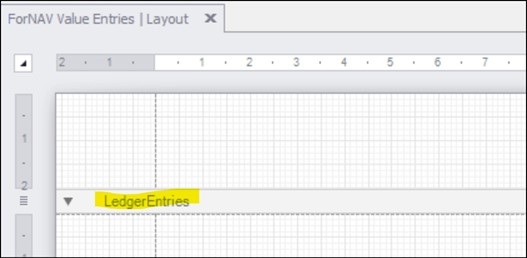
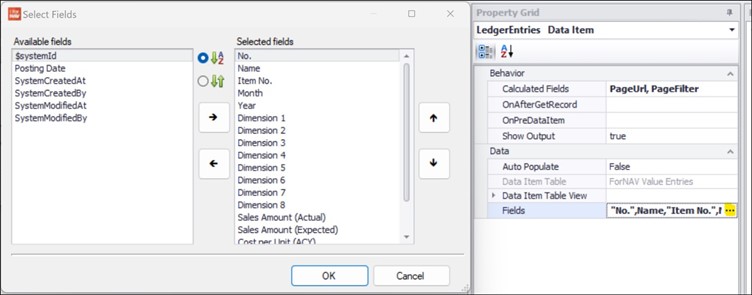
2) Add the data item you want as rows in the Excel sheet (each data item has its own worksheet) by dragging it from the Tool Box and selecting the table.
3) Add the fields you want as columns in the worksheet and add the fields that must be calculated to the Calculated Fields property
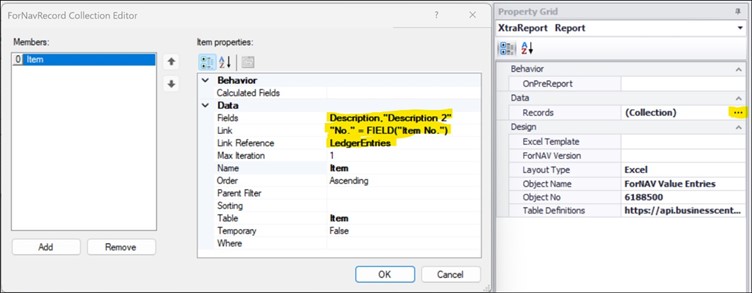
4) Add related fields by creating a JavaScript record, link it to the data item, and add the field you want from the table:
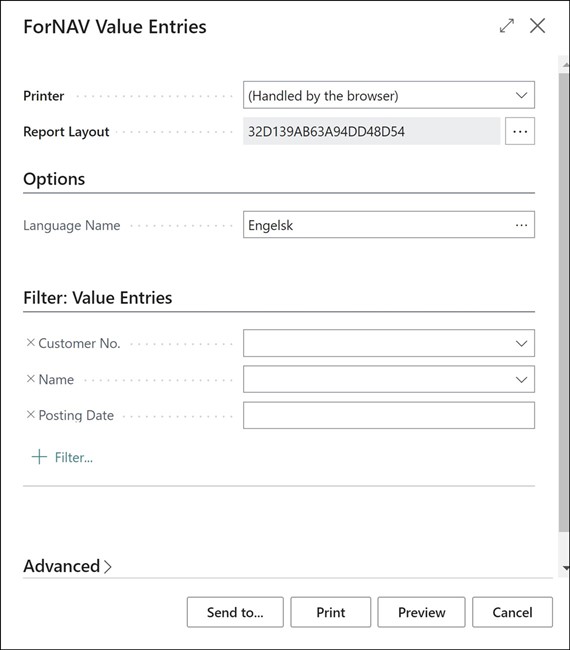
5) If the report is new, save it to the server and click Preview to see the result as a PDF.
To get other types of output, you can refer to the following table:
|
Wanted result |
Action for Cloud / Universal Code |
Action for OnPrem |
Result |
|
Send to PDF/Preview |
Send to PDF/Preview. |
Send to PDF/Preview. |
|
|
Send to Word |
Send to Word. |
Send to Word. |
.docx |
|
Send to Excel |
Select the Excel Data – ForNAV printer and click Print. |
Send to Excel. |
.xlsx |
|
Send to Excel dataset |
Select the Excel – ForNAV printer and click Print. |
Send to Excel dataset. |
.xlsx |
|
|
Select printer and click Print. |
Select printer and click Print. |
|
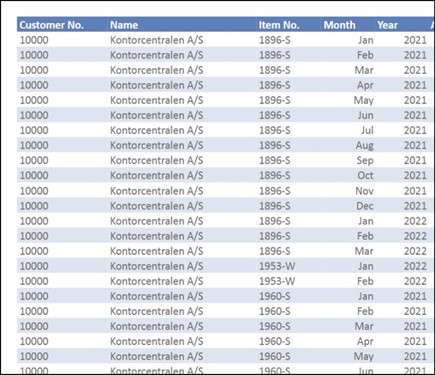
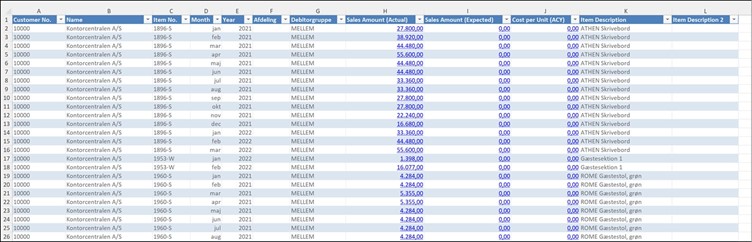
When sending to Excel, all the captions are in the local language or the language that is set in the report’s AL-code. For example:
If the record contains fields named PageUrl and PageFilter , these are automatically concatenated into a URL, which is added to a cell containing decimal numbers. This can then be used to call back into a Business Central page to see the origin of the data.
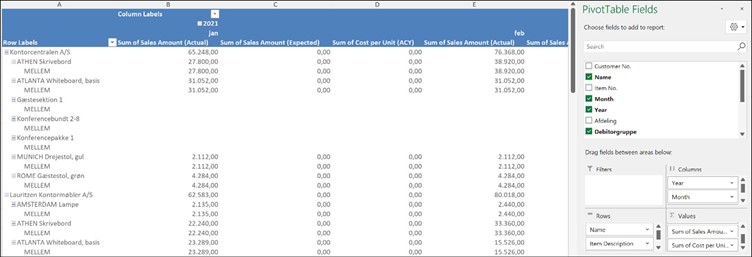
7) To customize the Excel sheet, you simply modify the Excel sheet that is created by the Send to Excel or Send to Excel Data options. For example: add a pivot table:
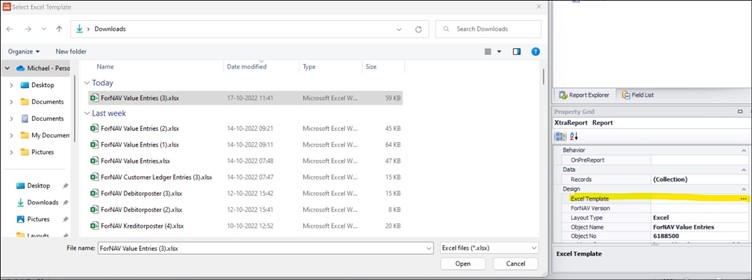
8) Finally, save the Excel sheet and import it into the layout as an Excel template:
When the template is uploaded, the data inside is removed to ensure data integrity.
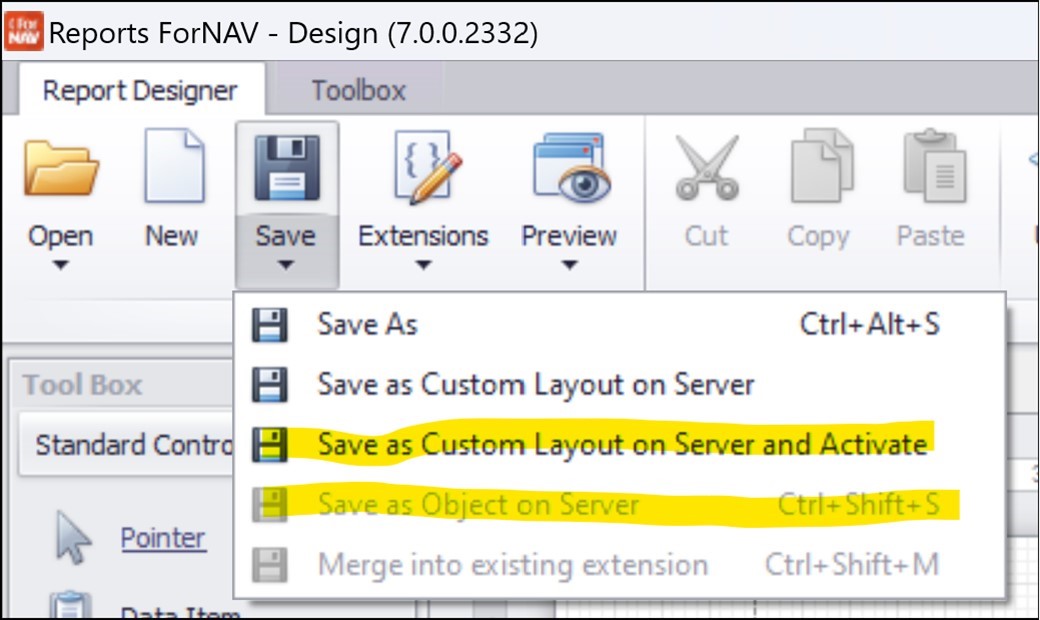
After the template is uploaded, you can save it to Business Central and activate it to be ready for use (if it was created on top of an existing report), or save it as a new Extension on the server (if it is a new report):